The Business Relocation Boom: Where Is Corporate America Moving?
Corporate America is on the move. Rising costs, remote work and shifting talent pools have prompted businesses of all sizes to reconsider where they operate, and the data reflects that. At Armstrong, we work with corporations navigating complex relocations every day, so we wanted to understand where that movement is actually happening. That’s why we put together a heatmap of business formation activity across U.S. metro areas, using U.S. Census Bureau data to show where new corporate activity is accelerating and where it’s cooling off.
But not all growth is equal. What looks like a relocation surge in one region may reflect a short-term spike rather than a lasting trend — and the difference matters if you’re making real estate or operational decisions based on it.
Here’s what the data actually shows, what it doesn’t and what broader federal sources tell us about where corporate America is really putting down roots.
The Geography of Business Growth
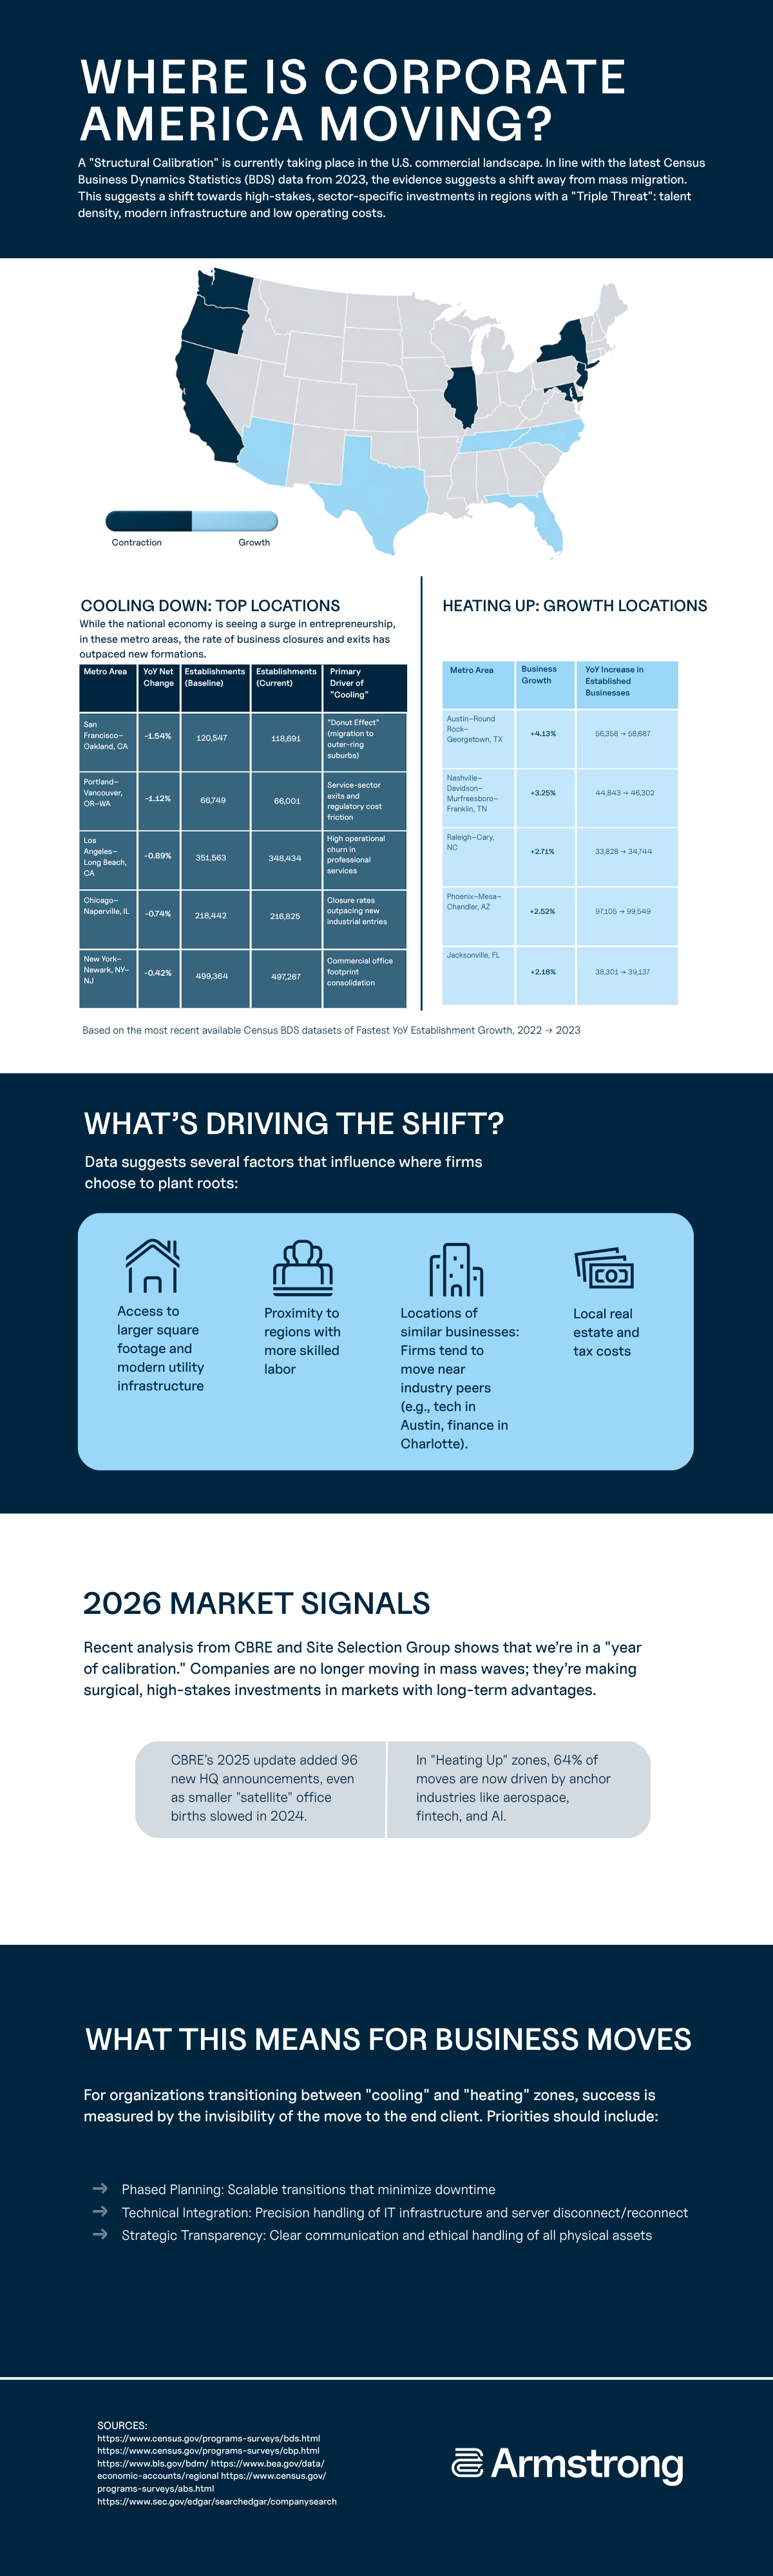
The heat scale here reflects year-over-year change in total business establishments from 2022 to 2023, using Census Business Dynamics Statistics. Hotter metros show accelerating new business filings — particularly high-propensity and corporate filings — relative to the baseline. Cooler metros show slower formation rates. This is a map of momentum, not a measure of closures or decline.
One important distinction: This tracks the birth of new business entities, not the physical moment a company packs up and crosses a state line. A region heats up when entrepreneurs file to create more new businesses, when corporate activity rises or when local industries expand. Think of it as a read on where the environment is most fertile for business — the aggregate result of thousands of independent decisions to put down roots in one place over another.
Where it’s Heating Up
These metro areas posted the strongest year-over-year establishment growth in the latest BDS data:
| Metro Area | Business Growth | YoY Increase in Established Businesses |
| Austin–Round Rock–Georgetown, TX | +4.13% | 56,358 → 58,687 |
| Nashville–Davidson–Murfreesboro–Franklin, TN | +3.25% | 44,843 → 46,302 |
| Raleigh–Cary, NC | +2.71% | 33,828 → 34,744 |
| Phoenix–Mesa–Chandler, AZ | +2.52% | 97,105 → 99,549 |
| Jacksonville, FL | +2.18% | 38,301 → 39,137 |
What these markets share is telling: competitive real estate costs relative to gateway cities, expanding talent pools and a gravitational pull from anchor industries, like tech and aerospace in Austin and finance and health care in Nashville. Firms aren’t moving here randomly. They’re following infrastructure, talent, and each other.
Where it’s Cooling Down
Slower growth doesn’t mean decline, but it does mean these major metros are losing momentum relative to other markets. In each case, the rate of new formations and corporate activity has softened compared to the national trend.
| Metro Area | Business Growth | YoY Increase in Established Businesses |
| San Francisco–Oakland–Berkeley, CA | +0.69% | 118,547 → 119,362 |
| Portland–Vancouver–Hillsboro, OR–WA | +0.47% | 65,749 → 66,059 |
| Los Angeles–Long Beach–Anaheim, CA | +1.06% | 347,563 → 351,239 |
| Chicago–Naperville–Elgin, IL | +0.48% | 217,442 → 218,484 |
| New York–Newark–Jersey City, NY–NJ | +1.02% | 494,320 → 499,364 |
The reasons for this vary by market. San Francisco continues to see businesses migrating outward to lower-cost suburbs rather than dissolving entirely. Portland and Chicago are contending with service-sector exits and operational cost friction. Los Angeles shows high churn in professional services, while New York’s slowdown reflects ongoing consolidation of commercial office footprints rather than outright exits. These are still enormous, economically vital metros. They’re just no longer where the growth edge is.
What’s Driving the Shift?
The data points to a consistent set of factors behind where businesses are choosing to plant roots. Access to modern infrastructure and larger square footage tops the list, particularly for companies whose legacy footprints no longer match their operational needs. Proximity to skilled labor is equally decisive, and increasingly, firms are making location decisions based on where their industry peers have already landed. Tech gravitates toward Austin, finance toward Charlotte and aerospace toward the Southeast. Once an anchor industry establishes itself in a market, it creates a pull that compounds over time.
Operating costs like real estate, taxes and regulatory overhead remain a significant variable, particularly for firms leaving high-cost coastal markets. But cost alone rarely drives a relocation. The markets seeing the strongest growth are offering a combination of affordability, talent and infrastructure that is proving hard to replicate elsewhere.
2026 Market Signals
Zooming out from the BDS data, the broader picture reinforces what the heatmap suggests. Census Bureau figures show seasonally adjusted business applications for January 2026 reached 532,319, up 7.2% from December. That volume of what economists call “act of hope” filings suggests the formation momentum captured in the 2022–23 data has continued rather than reversed.
Recent analysis from CBRE and Site Selection Group characterizes this as a “year of calibration.” The era of mass corporate migration appears to be giving way to something more deliberate: surgical, high-stakes investments in markets with long-term structural advantages. CBRE’s 2025 update recorded 96 new headquarters announcements even as smaller satellite office formations slowed. In the heating-up metros on this map, 64% of moves are now driven by anchor industries — aerospace, fintech and AI — rather than broad-based corporate shuffling.
Labor market data adds another layer. U.S. workers logged 3.2 million voluntary departures in December 2025, a continued signal of workforce mobility that historically precedes new business formation in growing markets. That mobile talent has to land somewhere, and state GDP figures suggest where. BEA data for 2024 shows growth ranging from 4.5% in Utah to -0.7% in North Dakota, with Q4 expansion recorded in 48 states and D.C. The economic foundations underpinning this map’s patterns aren’t fragile. They reflect sustained structural shifts in where American business activity is concentrating.
What to Know if You’re Planning a Move
The data can tell you where momentum is, but it can’t tell you whether a given market is right for your business — that requires a harder look at what’s actually driving the heat in your target destination and whether it aligns with what you need. Here are a few things worth examining before you commit to a move:
Labor Pool Fit
Cross-reference growth areas with BLS regional employment data to confirm that the specific talent your business depends on is actually concentrating there, not just talent in general.
Industry Alignment
Determine whether the growth in your target market is driven by your sector or a generalized surge. A market booming on aerospace momentum may not offer the same advantages to a professional services firm.
Infrastructure Lead Times
High-growth locations often come with tighter real estate markets and longer permitting timelines. What looks like an attractive landing spot on paper can involve operational delays that need to factor into your planning horizon.
Stakeholder Impact
A move affects more than operations. Consider how relocating to a new region influences employee retention, client relationships and how your brand is perceived in both the market you’re leaving and the one you’re entering.
The Move Itself
Relocating is both a strategic decision and a logistical one. The complexity of moving physical assets, IT infrastructure and personnel across markets is where well-planned relocations succeed or fail. The best destination in the world doesn’t matter if the transition creates months of downtime or disruption that your clients feel.That last part is where Armstrong comes in. The patterns on this map represent real decisions made by real organizations, and executing those decisions cleanly, with minimal disruption to operations and clients, is what we do. If you’re considering a corporate move, contact us today.
Methodology:
The “Business Relocation Boom” metric uses the Census Bureau’s Business Formation Statistics (BFS). BFS is based on EIN applications filed with the IRS (Form SS-4) and includes series such as High-Propensity Business Applications (HBA) and Business Applications from a Corporation (CBA).
Sources:
https://www.census.gov/econ/bfs/current/index.html
https://www.bls.gov/news.release/jolts.nr0.htm
https://www.bea.gov/news/2025/gross-domestic-product-state-and-personal-income-state-4th-quarter-2024-and-preliminary
https://www.census.gov/econ/bfs/pdf/bfs_current.pdf