U.S. construction trends: Where are the cranes
Federal data reporting shows aggregate U.S. construction at or near an all-time high, but sub-sector growth is concentrated rather than broad-based.
When you are managing complex corporate real estate transitions or optimizing a nationwide supply chain, understanding where capital is flowing helps you stay ahead of the curve. This overview highlights the infrastructure and geographic trends driving the construction sector, offering insights to support your next big move or facility expansion.
Key Takeaways
- Total construction value remains historically elevated while major new builds are highly concentrated in specific sectors like data centers, manufacturing and renewable energy
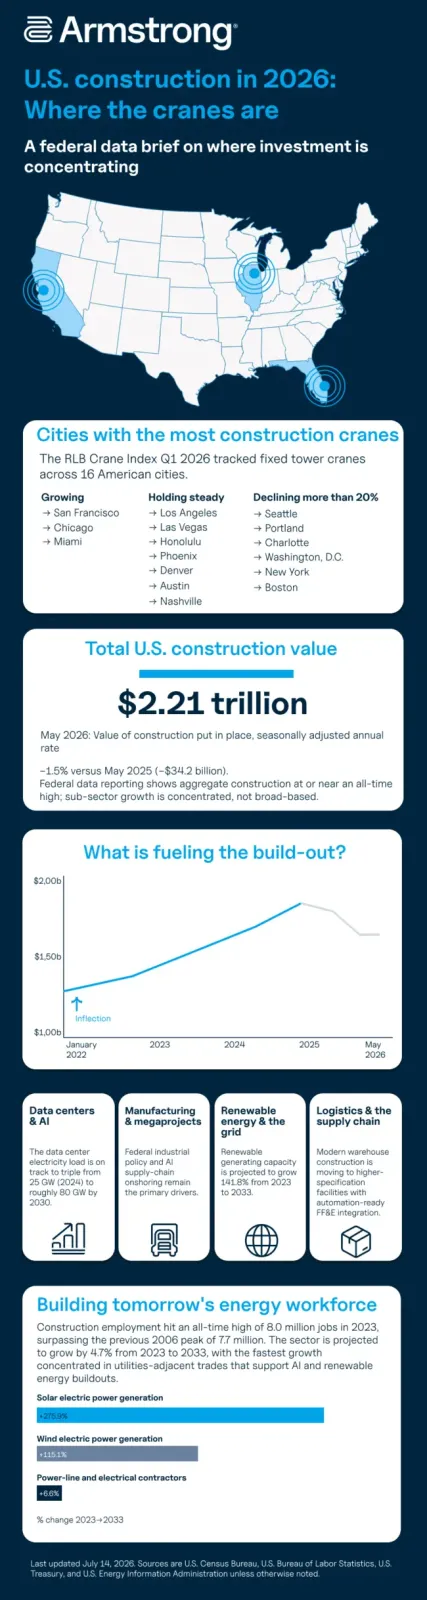
- Crane counts indicate strong ongoing activity in select cities like San Francisco, Chicago and Miami, while traditional hubs like New York and Boston show significant declines
- Construction employment reached an all-time high, with the fastest future growth projected in utilities-adjacent trades supporting tech and energy buildouts
- The sustained push for domestic manufacturing and modern automation-ready logistics facilities continues to reshape industrial real estate
Cities with the Most Construction Cranes
The RLB Crane Index tracked fixed tower cranes across 16 American cities, providing a real-time indicator of large-scale development. Based on these metrics, the cities seeing increased construction are San Francisco, Chicago and Miami. Conversely, cities experiencing more than 20% decreases in construction include traditional hubs such as Seattle, Portl and, Charlotte, Washington, D.C., New York and Boston.
The remaining cities tracked by the index are holding steady, maintaining their current crane counts without significant growth or decline:
- Los Angeles
- Las Vegas
- Honolulu
- Phoenix
- Denver
- Austin
- Nashville
Total U.S. Construction Value
As of May 2026, the value of construction put in place (seasonally adjusted annual rate) stands at $2.21 trillion. This represents a minor correction of -1.5% (or -$34.2 billion) compared to May 2025.
What is Fueling the Build-out?
The sectors seeing the most construction across the country are data centers, manufacturing, renewable energy and supply chain logistics. Technology adoption has fundamentally changed the construction industry, shifting developers’ focus away from traditional commercial builds and toward highly specialized, power-intensive and automation-ready facilities.
- Data centers and AI: Demand for AI computing is rapidly converting into square footage. The data center electricity load is on track to triple, growing from roughly 25 gigawatts to approximately 80 gigawatts by 2030
- Manufacturing and megaprojects: Computer, electronic and electrical manufacturing construction led the recent expansion. Federal industrial policy and AI supply chain onshoring remain the primary drivers of these massive facilities
- Renewable energy and the grid: To support new electrical demands, renewable generating capacity is projected to grow 141.8% over the next decade
- Logistics and the supply chain: Modern warehouse construction is shifting toward higher-specification facilities designed for the integration of automation-ready furniture, fixtures and equipment (FF&E)
Building Tomorrow’s Energy Workforce
Construction employment hit an all-time high of 8.0 million jobs in 2023, surpassing the previous 2006 peak of 7.7 million. The sector is projected to grow by an additional 4.7% from 2023 to 2033.
The fastest growth is concentrated in the specialized trades required to build AI and renewable energy infrastructure. Over this ten-year period, employment in solar electric power generation is projected to grow by 275.9%, wind electric power generation by 115.1% and power-line and electrical contractors by 6.6%
The Manufacturing and Tech Surge
Federal industrial policy funding and the sustained demand for AI data centers have lifted real spending on the construction of computer, electronic and electrical manufacturing since the start of 2022. While the trajectory cooled slightly through 2025, subsector construction spending remains at historically elevated levels.
- Real spending on manufacturing construction peaked at an annual rate of $244.3 billion
- The annual value of manufacturing construction was recently revised to $215.0 billion, a -12.0% correction
- The current seasonally adjusted annual rate of manufacturing construction stands at $223.8 billion
- Data centers are projected to account for up to 9% of total U.S. electricity generation by 2030, a significant increase from 4% in recent years
When you are breaking ground on a new facility, reliable logistics are the difference between finishing on time and facing costly delays. Discover how our construction services can keep your next large-scale build moving forward.
Methodology
The data presented in the accompanying visualization and this report reflect construction metrics tracked by the U.S. Census Bureau, the U.S. Bureau of Labor Statistics, the U.S. Treasury, the U.S. Energy Information Administration and the Rider Levett Bucknall (RLB) Crane Index. Data was last updated on July 14, 2026.
Frequently Asked Questions
What does the RLB Crane Index measure?
The Rider Levett Bucknall Crane Index tracks the number of fixed tower cranes on construction sites across major cities. It serves as a visual and quantitative indicator of large-scale, ongoing construction activity in specific real estate markets.
Why is data center construction growing so rapidly?
The rapid expansion of artificial intelligence capabilities requires massive amounts of computing power. This demand for AI processing translates directly into the need for new, highly specialized data center facilities and the electrical infrastructure to power them.
How does Armstrong Support large-scale facility construction and relocation?
We partner with commercial clients to manage complex logistics through comprehensive project management, specialized equipment moving, IT disconnect and reconnect services, secure warehousing, final mile and just-in-time delivery. This integrated approach minimizes downtime and ensures equipment arrives safely and on schedule.
Sources
- https://eta-publications.lbl.gov/sites/default/files/2026-01/lbnl_lllreview_dec_update_2025_final.pdf
- https://ablemkr.com/construction-job-trends-after-infrastructure-investments/
- https://www.bls.gov/opub/mlr/2024/article/industry- and-occupational-employment-projections-overview- and-highlights-2023-33.htm
- https://www.goarmstrong.com/commercial